
Mike Larson | Editor-in-Chief
Like Tom Hanks’ character at the end of the movie Cast Away, the State Street SPDR S&P 500 ETF (SPY) is at a key fork in the road. Whether it takes the bullish or bearish path is critical.
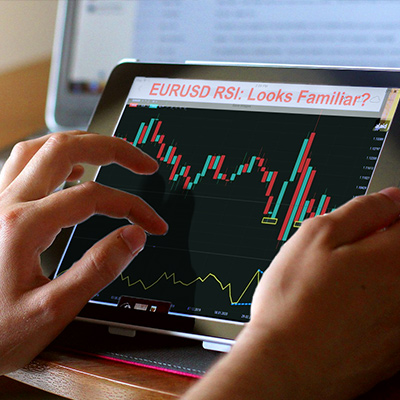
The stock market is closed for the Good Friday holiday, so it’s a good time to reflect on the bigger picture. My MoneyShow Chart of the Day shows SPY over a nine-month timeframe, along with a trio of exponential moving averages. I also included MACD and RSI indicators.

Source: StockCharts
You can see the recent breakdown under the 200-day EMA on high volume. It was followed by a high-volume reversal in the $630s…and a test of the underside of the 200-day. The shorter-term 20-day EMA also broke through the 200-day, while the 50-day EMA has started to roll over.
Another thing worth noting: RSI was steadily declining for some time, even as price kept climbing through early 2026. That “fits” with the broader narrative in place BEFORE the Middle East war broke out – namely, that tech and AI stocks were losing steam, investors were rotating into new leaders, and volatility was on the rise in all kinds of places, including metals.
The bulls will argue this is like the Liberation Day selloff in 2025. If President Trump backs down and some kind of Iran deal gets worked out, we’ll be off to the races again.
The bears will counter that markets have been weakening behind the scenes for a while. Not to mention that last year’s tariff threats weren’t accompanied by $100+ oil and $4+ gasoline.
All I can say with certainty is that we’re at a critical market juncture. If SPY takes a “wrong” turn, it might be time to insure your portfolio against grimmer outcomes.

Markets are closed for the holiday, but the answers to four key questions will determine where we go NEXT. In this MoneyShow Video Market Minute, I cover how energy is spiking, jobs are sending mixed signals, policy is in flux, and the S&P 500 is sitting right at a key decision point. Setups like this don’t stay quiet for long, so the question now is simple: are we breaking higher or rolling over?

Worst Quarter Since ‘22. Best Day Since ‘25. What’s Next? Find Out Here!
The stock market is trading all over the map. It just completed the worst quarter since 2022...while also closing it out with the best day since 2025!
If you want to find out what’s NEXT, you have only one place to be next week: The 2026 MoneyShow Masters Symposium Hollywood Florida! Get your pass to the Diplomat Beach Resort event by tapping the button below!
Sessions include everything from “Electric Gold” featuring Roger Conrad of Capitalist Times and “Why America’s Smaller Companies Deserve a Bigger Place in Your Portfolio” with Erin Gibbs of SlateStone Wealth...to “Themes for 2026: What to Expect for the Rest of This Year” from Stephanie Link of Hightower Advisors and “The Next Inning” from Charles Payne of Fox Business’ Making Money with Charles Payne.
Volume profiling provides unique insight into the profit-and-loss position of recent traders by identifying price levels at which significant buying and selling have occurred. The current volume profile analysis for the State Street SPDR S&P 500 ETF Trust (SPY) highlights that many people are trapped in the market with losses, warns Lance Roberts, editor of the Bull Bear Report.
Gold is closing in on its key $4,800 level, which is now both its 5- and 15-week moving averages. The chart below shows that gold's short-term indicator is extremely oversold, while its medium-term indicator is approaching the lows, note Mary Anne and Pamela Aden, editors of The Aden Forecast.


What did you think of today's newsletter?
- Great |
- Not Bad |
- Needs Work