- MoneyShow's Trading Insights
- Posts
- Trading Insights 05/23/25
Trading Insights 05/23/25
Mike Larson
May 23, 2025

Mike Larson | Editor-in-Chief
What’s it going to take to revive THIS chart?
That was my first thought yesterday when I looked at the chart of existing home sales. The National Association of Realtors reported that “used” home sales slid 0.5% to a seasonally adjusted annual rate of 4 million last month. That marked the worst April for that part of the housing market since 2009 – 16 years ago!
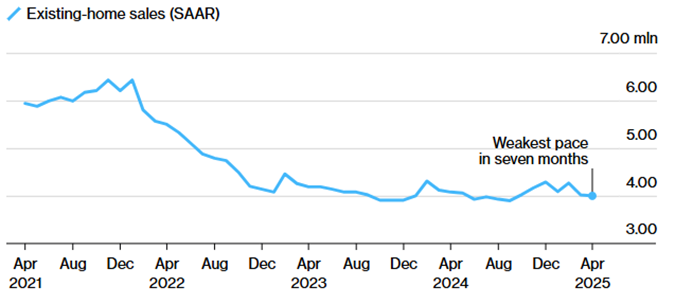
Source: National Association of Realtors via Bloomberg
Plus, as you can see in the MoneyShow Chart of the Day, this isn’t a fluke reading. Sales have been stuck in this beaten-down range for more than two years now.
That’s starting to weigh on home prices, as I wrote about Wednesday. Annual home price appreciation slowed to just over 4% in April, the smallest rise since July 2023, according to Redfin.
Separate data from S&P CoreLogic Case-Shiller shows that so-called “Sun Belt” markets are among those showing the worst performance. Prices are falling year-over-year in Tampa, stagnant in Dallas, and rising only slowly in Miami, Phoenix, and Atlanta.
Until interest rates drop (rather than RISE, as they’ve been doing lately!), we’re unlikely to see much progress for housing stocks. The SPDR S&P Homebuilders ETF (XHB) was recently down 9.6% year-to-date, while the iShares US Home Construction ETF (ITB) was off 13.5%.
But if you’re the contrarian type, keep an eye on those charts, too. If you see some bottoming action in XHB and ITB, you might be able to play them for a bounce.
One last thing: US markets will be closed on Monday – so there will be no Trading Insights newsletter on May 26. We will resume publication Wednesday, May 28. Happy Memorial Day!

Is the bond market flashing a warning that most investors are ignoring? In this episode of the MoneyShow MoneyMasters Podcast, Crossmark Global Investment’s chief market strategist Victoria Fernandez breaks down what the Moody’s downgrade of US debt really means — and how tariffs, inflation, and political uncertainty are reshaping the fixed income landscape.
SPX: Bearish Signals Abound as Rate Worries Rile Stocks
👉️ TICKER: SPXStocks retreated in Wednesday’s session as the yield on 10-year US Treasuries climbed. Our Composite Indicator, which measures all US stocks making new highs and lows on three time frames, has printed a bearish divergence and is heading for negative territory below the zero line, notes Ian Murphy, founder of Murphy Trading.
EPU: An Attractive ETF for Playing Higher Metals Prices
I don’t know much about Peru, outside of the fact that they make some great ceviche and chocolate. But I’ve been thinking about the country a lot lately. That’s because the iShares MSCI Peru ETF (EPU) was one of the funds in our international universe to finish Wednesday at new highs, writes Steve Strazza, chief market strategist at AllStarCharts.


What did you think of today's newsletter? |