[Editor’s Note: Welcome to the new and improved version of your Trading Insights newsletter! I hope you enjoy the clean look and updated content — and that it helps keep you two steps ahead of this volatile market.]
You know what indicator I watch like a hawk? Credit spreads! There’s a very simple reason: Problems in the credit market usually PRECEDE problems in the equity market.
With that said, check out my MoneyShow Chart of the Day. This is from a slide in my presentation about markets at last week’s MoneyShow/TradersEXPO Las Vegas.
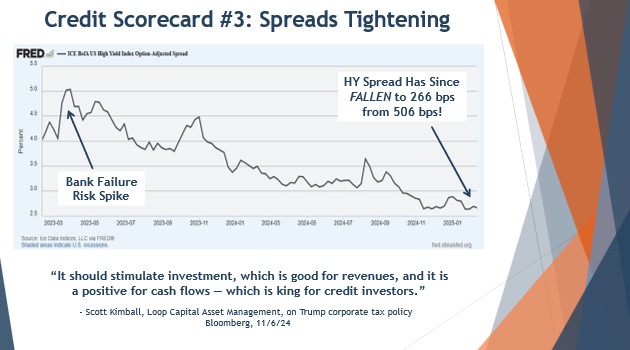
It shows the ICE BofA US High Yield Index Option-Adjusted Spread. It’s a mouthful, I know. But what it shows is the difference (aka “spread”) between yields on high-yield (or “junk”) bonds and yields on underlying US Treasuries.
Since junk bonds are inherently riskier than government bonds, junk bond investors demand extra yields above and beyond what US Treasuries pay. When they’re worried about credit risk, increased market volatility, or other problems, the amount of extra yield they demand goes up. Or in other words, spreads WIDEN.
Ever since the bank failure wave in early 2023, spreads haven’t been widening. They’ve been TIGHTENING.
The quote at the bottom of my slide notes that some of the move stems from President Trump’s election. That’s because the administration’s corporate tax policies are expected to be favorable for companies. But that’s only part of the story. Risk appetite has been rising for some time due to stronger earnings and expectations for a soft landing in the economy. That’s a bullish development for stocks.
Simply put: Until the credit market “goes” (spreads surge/“blow out”), more equity market gains should flow.
The best traders “stack” probabilities in their favor – using different types of analysis and multiple trading signals to increase their chances of success. They know how to manage risk. And they don’t dig their heels in when they face the “Right idea, wrong time” dilemma. Those are just a few of the pearls of wisdom shared by Blake Morrow, co-founder of Forex Analytix, in this recent MoneyShow MoneyMasters Podcast segment.

SPY: One Chart You Simply CAN'T Ignore as a Trader
👉 TICKERS: AAPL, MSFT, NVDA, SPYWhen investors look for long-term bullish S&P 500 signals, they look at the US CPI, interest rates, and M2 supply (relatively liquid assets in the US economy). This is a mistake. If you’re trading the S&P, you can’t just focus on US liquidity. You need to focus on global liquidity instead, observes Gav Blaxberg, CEO of Wolf Financial.
👉 TICKER: SPY
Last Wednesday’s note highlighted the new all-time high on the S&P500. But as ever, a deeper look under the surface can reveal a different picture. We just had an important divergence, writes Ian Murphy, founder of Murphy Trading.