
Mike Larson | Editor-in-Chief
Every once in a while, I’ll see a chart that begs a simple question: “If you didn't know what this stock or fund was, would you buy it?” That was the case recently with the iShares 20+ Year Treasury Bond ETF (TLT).
Let’s be honest. It’s easy to make a case AGAINST US Treasuries. The potential inflationary impact of tariffs. The risk foreign holders will dump US bonds. The exploding US budget deficit and debt load. Worries the Federal Reserve will get policy wrong. The list goes on and on.
Yet I’ve noted in columns and comments on social media that from a TECHNICAL perspective, there’s a lot to like. Or in plain English: If you saw this “Mystery” MoneyShow Chart of the Day below -- without a name or ticker at the top – would you hit the “Buy” or “Sell” button?
Mystery Fund: Buy or Sell?
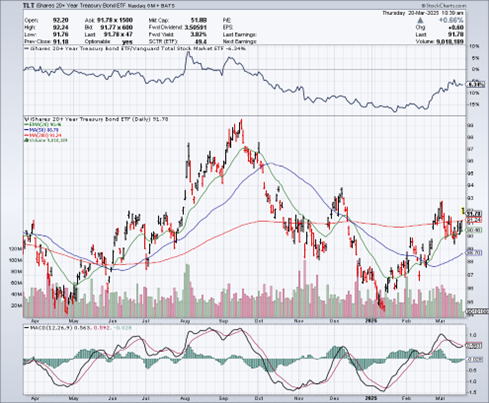
Source: StockCharts
The answer is “Buy”...right? You have a nasty washout low on heavy volume, followed by positive price action. That includes a couple of gap ups, with subsequent, successful retests.
You also have short-term (20-day) and intermediate-term (50-day) moving averages turning up. MACD has been mostly supportive. And now, it looks like TLT could mount an assault on the $93 area – something that would signal a powerful breakout if it happens.
So, sure. There are plenty of cogent, rational-sounding reasons to avoid Treasuries. But when it comes to the chart, what’s the message it’s sending? You know my answer.

Click image to watch on our MoneyShow YouTube channel
The markets have been flipped upside down in the last month. Stocks tumbled, then surged. Gold soared past $3,000 an ounce. Volatility shot through the roof. So…is this the start of a major shift, or just a temporary shakeout?
In this special “Market Roundtable” episode of the MoneyShow MoneyMasters Podcast, top financial experts Kenny Polcari of SlateStone Wealth, Tom Hayes of Great Hill Capital, and Jim Bianco of Bianco Research break down what’s driving markets and fueling investor uncertainty. And they tell you what to expect next for stocks, gold, interest rates, the dollar, and more!
The S&P 500 fell right to the 10%-down mark, then rebounded. Here are three ETF charts I’m watching to determine where we go next, says Robert Isbitts, founder of Sungarden Investment Publishing.
USD/JPY is at a crossroads, with the market’s reaction to the Federal Reserve likely to determine whether the pair pushes higher or retreats in the days ahead, suggests Fawad Razaqzada, technical analyst at Trading Candles.


What did you think of today's newsletter?
- Great |
- Not Bad |
- Needs Work