
Mike Larson | Editor-in-Chief
Have we seen THE LOW for the SPDR S&P 500 ETF (SPY) yet? Was it last Thursday? I don’t know. No one does. But a review of the last two major market bottoms can shed some light on what one MIGHT look like this time.
Remember what I wrote on Friday. Investor sentiment is as bad (or worse) as it was around the Covid-19 low in 2020 and the final washout in October 2022. So, let’s look at those two bottoms and see what transpired.
I’ll start with my first MoneyShow Chart of the Day – the action in March-April 2020. You can see the relentless, high-volume selling in the first three weeks of March. SPY traded along the lower Bollinger Band and RSI confirmed weakness for days on end.
SPY (3/1/20 - 4/30/20)
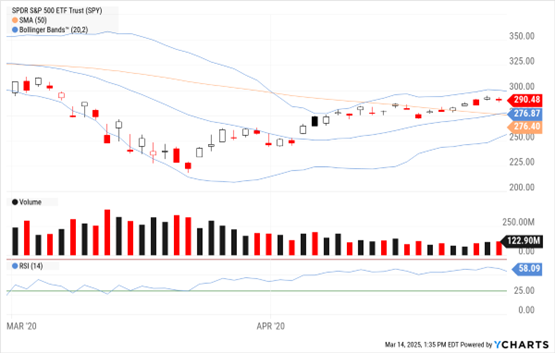
But then on 3/19 and 3/22, we had high-volume selling, a minor RSI divergence, and a quasi-abandoned baby candlestick pattern show up. That was followed by a lighter-volume pullback a few days later, which got bought. After that, we were off to the races.
Now, here’s my second MoneyShow Chart of the Day – the action in September-October 2022. You can see yet another relentless move throughout September – with high-volume liquidation, SPY trading along the lower Bollinger Band, and RSI confirming the weakness.
SPY (9/1/22 - 10/31/22)
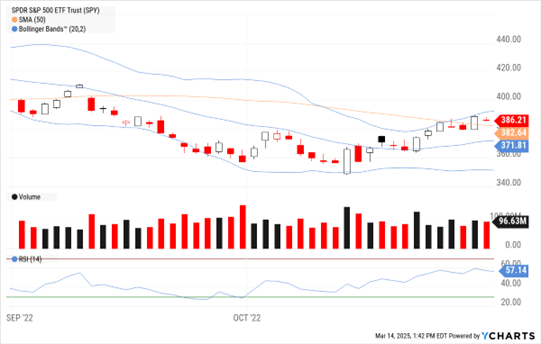
But then we had a minor divergence on 9/29, followed by a wildly successful re-test on 10/12. That brought out the bulls for good.
Friday’s rally was a start. But so far, it’s only that – a START. If you want to wait for confirmation that this is “The Low” for this selloff, you’ll want to see what happens in the next few days.
Look for volume to lighten up on down days and an RSI divergence to show up. Then watch how investors handle the first pullback after a few days of rallying. With any luck and some patience, you’ll be on your way to trading a TRUE SPY bottom in no time.

Matthew Williamson brings a unique blend of finance, risk management, and education to his role as a trading coach for SensaMarket. In this session, he shows you how institutional traders move the markets and how to trade alongside them using real-time options flow data. Specifically, he breaks down how to interpret large block orders, sweeps, and volume spikes — leveraging SensaMarket’s 100+ pre-built strategies to maximize your trading edge.
The selling in US growth stocks and funds like the Technology Select Sector SPDR ETF (XLK) continues. Meanwhile, the relative strength in funds like the iShares MSCI Japan ETF (EWJ) looks interesting, writes JC Parets, founder of AllStarCharts.
👉 TICKER: BABA
We just had another down week for the market, with the major indices probing new correction lows as recently as Thursday. That obviously keeps the intermediate-term evidence pointed down. Still, Alibaba Group Holding Ltd. (BABA) looks interesting for a trade, highlights Mike Cintolo, editor of Cabot Top Ten Trader.


What did you think of today's newsletter?
- Great |
- Not Bad |
- Needs Work